It only takes 15 minutes with this automated test to generate this report and only a few seconds to read it.
Keeping your patients safe and Generating over $350
How to read an ENG

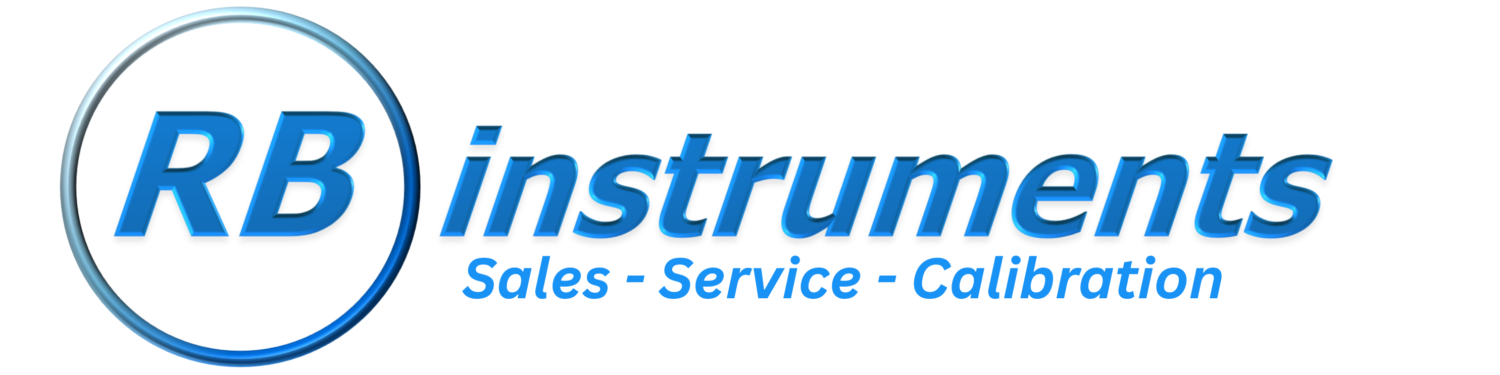
Horizontal: above image
All we are interested in is the 1-4 frequency range. I have yellowed the area in the above example.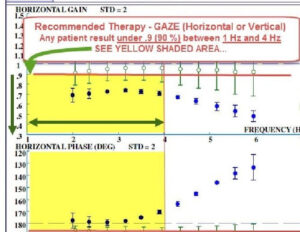
All we are interested in is the 1-4 frequency range. I have yellowed the area in the above example.
Gain (speed of the eye): This is the upper half of the above graph and is indicated on the left hand side of the graph. Find the .9 and draw a line straight across. In the above example I have done this in red. Any blue dots below this line would indicate that these eyes are moving slow and horizontal therapy would be recommended. So in the above example we are well below the .9 mark, so these eyes are moving very slow. Vertical gain would be measure the same way.
Test your self on the upper portion of the next image.
Answer: Did you say these eyes are moving slow as well? You would be right.
Vertical:
Once again all we are interested in is the 1-4 frequency range. I have yellowed the area in the above example.
Vertical Phase (Range of eye movement): This is the Lower half of the above graph and is indicated on the left hand side of the graph. Find 185 and draw a line straight across. In the above example I have done this in red. Any blue dots above this line would indicate that the eyes are stopping short and vertical therapy would be recommended. In the above example you can see these eyes were stopping very short. Read Horizontal phase the same way.
Test your self: go back to the first graph and see if you can read it.
Answer: Did you say the eyes were stopping short as well? You would be right.
Wow! That was easier than you thought. Don’t waste time sending out your VNG’s for interpretation. With the VAT+ system you could have these results in less than 20 minutes. With a little practice you could read these at a glance and recommend the proper therapy
Want to test yourself ? Visit this web page for more chances to read graphs and to catch up on any of the information you might have missed.